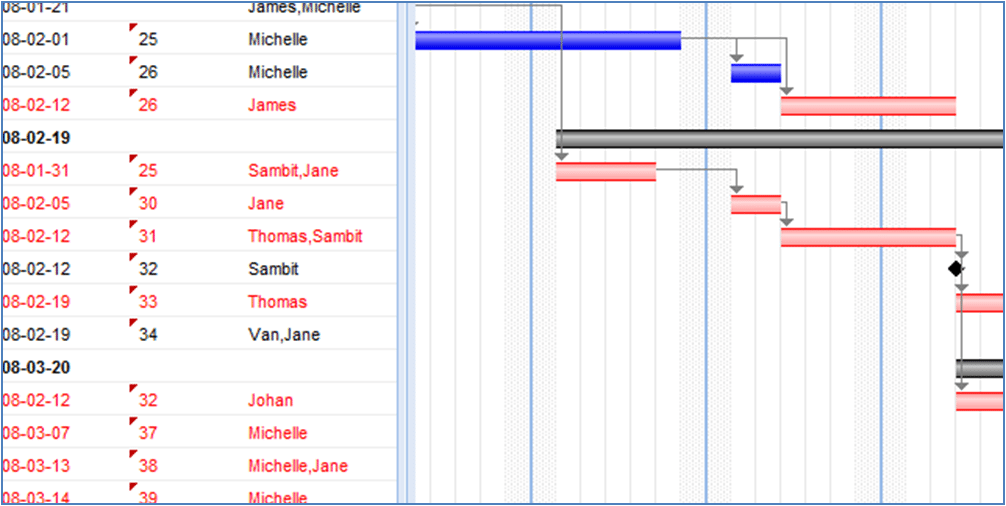
Let me take you through the Project Plan in Deskera  The Task Grid lists out all your project tasks along with their duration, dates, predecessors and resources. Now it not only looks like an Excel sheet, but acts like one too. We find it much easier to edit task details in the cells in the classic Excel fashion rather than having to
- Click to open a form
- Find the fields you want to change and then key in the information and finally
- Click to close the form (and some people seem to throw in a confirmation message everywhere just for kicks)
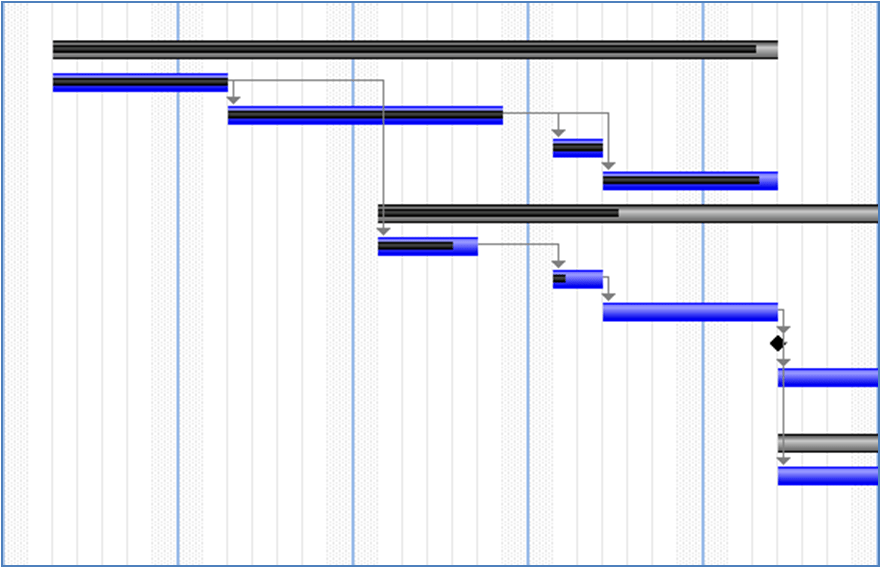
On the right, we have the Gantt chart. An interactive one, you drag and drop tasks and links much like Microsoft Project, but the coolest thing is that it’s truly collaborative, REAL-TIME. Much like Google Docs. We weren’t kidding about combining the best of both worlds. We actually combine the collaboration and planning possibilities comparable to the leading simple Gantt chart makers in the market. Now let’s move on to the toolbar: 
- New template:Many projects within a company tend to have a set of common tasks, hence the inclusion of templates. Templates not only make it easier to enter the same tasks across projects, but at the same time ensure consistency across projects, making it easier to compare performance. So select those common tasks in the plan and click ‘New Template’, give it a name and you are done.
- Insert Template:To insert tasks from a template into you plan, select a blank row, click ‘Insert Template’ and select the one you want.
- New Task:Adds a blank row in the grid where you can start keying in the information directly
- Indent and Outdent:Indenting a task pushes it to a lower level while outdenting it promotes the task to a higher level. So when you indent a task, it’ll become a ‘sub task’ of the task above it and outdenting it would make it a ‘parent’ task of the one below it.
- Show Progress:Displays the progress(% complete) of all the tasks on the Gantt chart.

- Overdue Tasks:Highlights only the tasks which are overdue on the Gantt Chart.

- Show Priority:Displays the priority level(High/Moderate/Low) of all the tasks
- Show Resources:Displays color-coded resources for all tasks on the Gantt Chart.
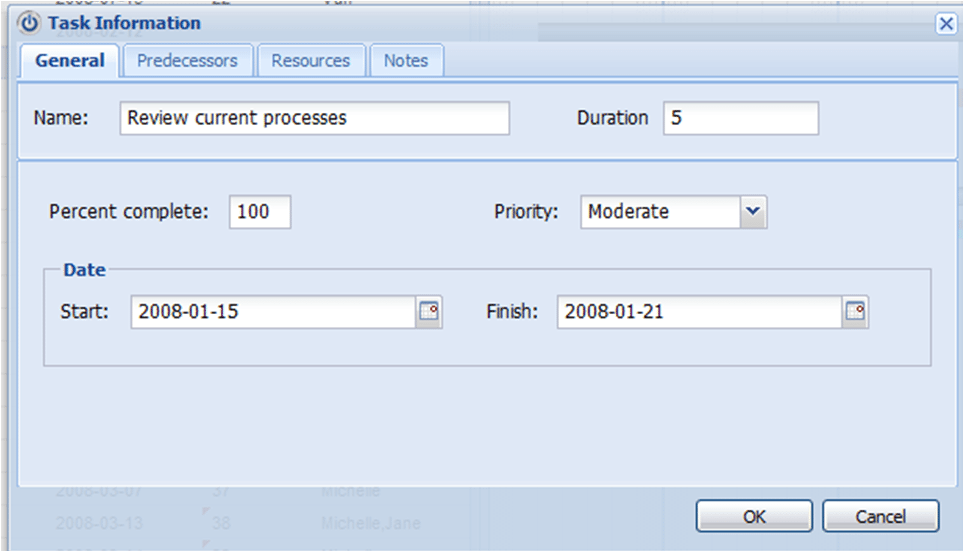
- Task Information:You can update and edit task information by clicking here. Update the task’s % completion and attach notes as well.
- Import/Export Plan:Import/export your existing plans from Microsoft Project. Both .mpp and .mpx files are supported.
- Reports:Generate extensive reports on your project’s status. You can generate reports on activities, resources, milestones and you can also track your project costs.


