
What if you could predict the financial health of your business before problems arise—or better yet, spot opportunities for growth before your competitors do? The answer lies in consistently tracking the right financial KPIs (Key Performance Indicators). These metrics provide a clear view of your company’s performance and help you make smarter, data-driven decisions to stay ahead in a competitive landscape.
Financial KPIs go beyond simple profit and loss figures. They offer insights into cash flow, efficiency, solvency, and profitability—all critical factors that determine whether your business is on track or drifting off course. Whether you’re a startup founder managing investor expectations or a CFO optimizing multi-departmental budgets, understanding and acting on these KPIs is essential.
From measuring your operating cash flow to analyzing your return on equity, financial KPIs help you align your day-to-day operations with long-term goals. They serve as a compass, guiding your business strategy, helping allocate resources effectively, and highlighting areas that need improvement. But with so many metrics available, it’s crucial to focus on the ones that truly matter.
This is where tools like Deskera ERP come into play. Deskera ERP simplifies financial management by offering real-time insights, customizable dashboards, and automated reports for key KPIs. Designed for small to mid-sized businesses, it streamlines everything from accounting and invoicing to inventory and payroll—so you can track, analyze, and act on financial data with ease.
What Are Financial KPIs?
Financial KPIs (Key Performance Indicators) are measurable values that reflect the financial health and performance of a business. These metrics help organizations evaluate how well they are achieving their financial goals and objectives. By tracking financial KPIs regularly, companies can gain critical insights into profitability, liquidity, efficiency, and stability.
Unlike general performance indicators, financial KPIs are strictly tied to monetary outcomes. Examples include net profit margin, cash flow, return on investment (ROI), and current ratio. Each KPI serves a specific purpose—some reveal short-term solvency, others indicate long-term growth potential.
Tracking financial KPIs helps decision-makers identify trends, address inefficiencies, and ensure the company remains on a sustainable growth path. Whether you're planning budgets, assessing performance, or preparing for investor meetings, these KPIs form the foundation of sound financial management.
Categories of Financial KPIs
Financial KPIs can be grouped into several key categories, each highlighting a specific aspect of your business's financial performance. Understanding these categories helps you focus on the right metrics based on your business goals and operational needs.
1. Profitability KPIs
These KPIs measure your ability to generate profit relative to revenue, assets, or equity. They help you assess how efficiently your business turns income into profit.
Examples:
- Gross Profit Margin
- Net Profit Margin
- Return on Assets (ROA)
- Return on Equity (ROE)
2. Liquidity KPIs
Liquidity KPIs indicate your company’s ability to meet short-term obligations using current assets. These metrics are essential for managing cash flow and ensuring financial stability.
Examples:
- Current Ratio
- Quick Ratio (Acid-Test Ratio)
- Working Capital
3. Efficiency KPIs
Efficiency KPIs show how well your business uses its assets and resources to generate revenue. They help identify operational bottlenecks or underutilized assets.
Examples:
- Inventory Turnover
- Accounts Receivable Turnover
- Accounts Payable Turnover
- Asset Turnover Ratio
4. Leverage KPIs
These KPIs evaluate the level of debt your business uses to finance operations and growth. They are critical for understanding financial risk and solvency.
Examples:
- Debt-to-Equity Ratio
- Interest Coverage Ratio
- Debt Ratio
5. Valuation KPIs (typically relevant for investor-focused businesses)
Valuation KPIs reflect the market perception of a company’s worth and are often used in strategic planning, mergers, or investment decisions.
Examples:
- Earnings Per Share (EPS)
- Price-to-Earnings Ratio (P/E)
- Enterprise Value (EV)
By categorizing financial KPIs, you can better prioritize what to monitor regularly and align your financial tracking with business strategy.
Importance of Financial KPIs
Tracking your company’s financial health isn't just about knowing whether you're making a profit—it's about understanding the story behind the numbers. This is where financial KPIs (Key Performance Indicators) come into play.
They offer clear, quantifiable insights into your business’s financial performance, helping you make informed decisions and drive long-term success.
1. Better Financial Visibility
Financial KPIs offer a real-time snapshot of your business’s financial condition. By monitoring metrics such as net profit margin, current ratio, or cash flow, you gain a clear view of where your money is coming from, where it’s going, and how efficiently it’s being used. This clarity helps you stay on top of financial health and avoid unpleasant surprises.
2. Informed Strategic Planning
KPIs serve as essential tools for setting goals and shaping financial strategies. Whether you're budgeting for the next quarter or planning a product launch, financial KPIs help guide your decisions. They reveal which areas are thriving and which need attention, allowing you to allocate resources effectively and set realistic, data-driven targets.
3. Early Problem Detection
Proactive tracking prevents small issues from becoming major setbacks. A sudden dip in gross profit margin or a rising debt-to-equity ratio can signal operational or financial issues. Regularly reviewing KPIs enables you to detect warning signs early and take corrective action before they impact your bottom line.
4. Increased Stakeholder Confidence
Consistent KPI reporting builds trust with investors, lenders, and partners. Financial transparency backed by reliable data reassures stakeholders that your business is stable and well-managed. This credibility is crucial when seeking funding, negotiating partnerships, or presenting quarterly performance updates.
5. Improved Operational Efficiency
Financial KPIs reveal how efficiently your business is using its resources. Metrics like inventory turnover or accounts receivable turnover show how well you’re managing assets. When inefficiencies are identified early, processes can be optimized to reduce waste, speed up cash flow, and improve overall productivity.
6. Performance Benchmarking
Compare your business performance against industry standards or competitors. KPIs allow you to measure your success relative to others in your sector. This comparison highlights competitive advantages and areas where your business may be falling behind, allowing for targeted improvements.
7. Goal Tracking and Accountability
Use KPIs to hold teams accountable and measure progress toward objectives. Setting KPI targets for departments or teams encourages ownership and performance tracking. It ensures everyone in the organization is aligned with the company’s financial goals and working toward a shared vision.
8. Supports Long-Term Sustainability
KPIs help businesses stay financially resilient over time. By tracking key indicators like cash reserves, debt levels, and return on investment, you can ensure that the business is not just growing—but growing in a way that’s sustainable and adaptable to market changes.
Top Financial KPIs Every Business Should Track
Financial Key Performance Indicators (KPIs) are essential metrics that help measure the financial health, operational performance, and profitability of a business.
Tracking the right KPIs enables business leaders, CFOs, and finance teams to make informed decisions, forecast future performance, and optimize financial strategies.
1. Gross Profit Margin
Definition: Gross profit margin calculates the percentage of revenue left after deducting the cost of goods sold (COGS). This KPI measures how well a company is producing its products relative to the cost of materials and labor. A high gross margin indicates a company is managing production costs effectively, while a low margin may suggest inefficiencies or pricing issues.
Formula:
(Net Sales – COGS) / Net Sales × 100
2. Operating Margin (Return on Sales)
Definition: Operating margin measures the proportion of revenue remaining after covering operating expenses, excluding taxes and interest. This KPI gives insight into a company's ability to generate profit from core business activities. It’s an important indicator of efficiency and how well a company controls its costs relative to its revenue, showing how profitable a business is from its operational activities.
Formula:
Operating Income / Net Sales × 100
3. Net Profit Margin
Definition: Net profit margin reveals the overall profitability of a company after accounting for all expenses, including taxes and interest. This KPI indicates how much profit a company earns from each dollar of revenue. It’s crucial for assessing the financial health and long-term sustainability of a business, and a high margin is often a sign of a well-managed company.
Formula:
Net Income / Total Revenue × 100
4. Operating Cash Flow Ratio
Definition: Operating cash flow ratio measures a company’s ability to cover its short-term liabilities using cash generated from core operations. A higher ratio suggests that a business has sufficient operating cash flow to meet its obligations without relying on external financing. It’s an important indicator of financial stability, particularly for businesses with fluctuating revenue or expenses.
Formula:
Operating Cash Flow / Current Liabilities
5. Current Ratio
Definition: The current ratio measures a company's ability to pay short-term obligations with its current assets. A ratio above 1 suggests the business has enough assets to cover liabilities, which is a positive indicator of liquidity. This KPI is widely used to evaluate financial health and the company's ability to weather short-term financial challenges without needing external funding.
Formula:
Current Assets / Current Liabilities
6. Working Capital
Definition: Working capital represents the difference between a company's current assets and current liabilities, indicating whether a business can cover its short-term financial obligations. Positive working capital means a company can efficiently manage day-to-day operations, while negative working capital might signal potential liquidity problems. This metric is crucial for understanding the business’s operational efficiency and overall financial health.
Formula:
Current Assets – Current Liabilities
7. Quick Ratio (Acid-Test Ratio)
Definition: The quick ratio provides a stringent measure of liquidity by excluding inventory from current assets, focusing only on assets that can be quickly converted into cash. A quick ratio greater than 1 is often considered healthy, indicating that a company can cover its short-term obligations even if inventory can’t be sold quickly, providing a clear view of financial health.
Formula:
(Current Assets – Inventory) / Current Liabilities
8. Gross Burn Rate
Definition: Gross burn rate is a critical KPI for startups, measuring the rate at which a business spends its available capital before becoming profitable. It’s calculated by dividing the total monthly operating expenses by the total available capital. This metric is especially important for venture-backed startups as it indicates how quickly the company is consuming its funds and when it may need additional funding.
Formula:
Total Monthly Operating Expenses
9. Accounts Receivable Ratio
Definition: The accounts receivable ratio shows the percentage of receivables that are current, which indicates the effectiveness of a company’s collections process. A higher ratio implies better cash flow management and suggests that the company is timely in collecting outstanding invoices. A lower ratio may indicate issues with overdue payments and could require attention to credit policies and collections strategies.
Formula:
(Total AR – Past Due AR) / Total AR
10. Accounts Payable Ratio
Definition: This ratio reveals the proportion of accounts payable that are overdue, providing insight into how well a company manages its payments to suppliers. A high ratio might indicate delayed payments, potentially affecting relationships with suppliers. Conversely, a lower ratio suggests efficient payment practices and good supplier relationship management, which is vital for maintaining trust in business operations.
Formula:
(Total AP – Past Due AP) / Total AP
11. AP Turnover Ratio
Definition: The accounts payable turnover ratio measures how frequently a business pays off its suppliers within a set period. A high ratio indicates that a company is paying its suppliers quickly, while a low ratio could indicate cash flow issues or delayed payments. This metric is important for businesses to assess how well they manage supplier relationships and their ability to meet short-term obligations.
Formula:
Net Credit Purchases / Average Accounts Payable
12. Average Invoice Processing Cost
Definition: This metric calculates the average cost involved in processing each supplier invoice, including administrative expenses, software costs, and employee time. By tracking this cost, companies can identify inefficiencies in their accounts payable process. Reducing invoice processing costs can significantly improve operational efficiency, especially for companies with a high volume of supplier invoices.
Formula:
Total AP Processing Cost / Number of Invoices
13. Days Payable Outstanding (DPO)
Definition: Days Payable Outstanding (DPO) measures the average number of days a business takes to pay its suppliers. A higher DPO suggests a company is effectively using its cash flow and taking longer to pay, while a lower DPO could mean the company is paying suppliers more quickly. This metric is important for managing cash flow and supplier relationships.
Formula:
(Accounts Payable × 365) / COGS
14. Accounts Receivable Turnover
Definition: This ratio evaluates how frequently a company collects its receivables during a specific period, typically annually. A high accounts receivable turnover ratio indicates that a business collects payments quickly, enhancing cash flow. A low ratio may suggest that the company has difficulty collecting payments, leading to potential cash flow issues and the need to review credit policies or collection efforts.
Formula:
Net Credit Sales / Average Accounts Receivable
15. Days Sales Outstanding (DSO)
Definition: Days Sales Outstanding (DSO) calculates the average number of days it takes for a business to collect payment after a sale. A high DSO can indicate that a company is slow in collecting payments, which can strain cash flow. A lower DSO is desirable as it means the company receives payments more quickly, improving liquidity and operational efficiency.
Formula:
365 / AR Turnover
16. Inventory Turnover Ratio
Definition: Inventory turnover measures how often a company sells and replaces its inventory within a given period. A high turnover ratio indicates that inventory is selling quickly, while a low ratio may suggest overstocking or weak sales. This metric is important for businesses to manage stock levels efficiently and ensure they don’t tie up too much capital in unsold inventory.
Formula:
COGS / Average Inventory
17. Days Inventory Outstanding (DIO)
Definition: Days Inventory Outstanding (DIO) measures the average number of days that inventory remains unsold before being converted into cash. A lower DIO is preferred as it suggests that inventory is being sold more quickly, enhancing cash flow and reducing holding costs. A high DIO can indicate excess stock or slow-moving products, which could impact liquidity.
Formula:
365 / Inventory Turnover
18. Cash Conversion Cycle (CCC)
Definition: The Cash Conversion Cycle (CCC) measures how long it takes a company to convert its investments in inventory and accounts receivable into cash. The shorter the CCC, the more efficiently a company is managing its working capital. A positive CCC indicates a business is effectively managing its cash flows, while a long cycle can indicate inefficiencies in inventory management or accounts receivable collections.
Formula:
DIO + DSO – DPO
19. Budget Variance
Definition: Budget variance tracks the difference between a company’s actual financial performance and its planned budget. A positive variance indicates that actual results exceeded expectations, while a negative variance means actual results fell short. This KPI helps businesses identify areas where cost controls or revenue projections need adjustment and can guide future budgeting processes.
Formula:
(Actual – Budgeted) / Budgeted × 100
20. Payroll Headcount Ratio
Definition: Payroll headcount ratio measures the number of HR personnel relative to the total number of employees within an organization. It helps determine whether the HR function is appropriately staffed to handle recruitment, training, and employee management. A higher ratio may suggest an overstaffed HR department, while a lower ratio may indicate under-resourcing in HR.
Formula:
HR Staff / Total Employees
21. Sales Growth Rate
Definition: Sales growth rate tracks the percentage increase in sales over a specific period, usually year-over-year. It provides insight into how well a company is performing in terms of revenue generation. A high sales growth rate is a positive indicator of business expansion and increasing demand for products or services, while slow growth may suggest challenges in the market.
Formula:
(Current Sales – Previous Sales) / Previous Sales × 100
22. Fixed Asset Turnover
Definition: Fixed asset turnover measures a company's ability to generate sales from its fixed assets, such as buildings, machinery, and equipment. A higher ratio indicates that the business is using its assets efficiently to generate revenue. Conversely, a low ratio may suggest that the company is underutilizing its fixed assets or has excess capital tied up in them.
Formula:
Net Sales / Average Net Fixed Assets
23. Return on Assets (ROA)
Definition: Return on assets (ROA) measures how efficiently a company uses its assets to generate profits. It’s a crucial indicator for assessing asset utilization and profitability. A higher ROA signifies that the company is effective in converting its assets into earnings. This ratio is particularly useful for evaluating asset-intensive industries like manufacturing and real estate.
Formula:
Net Income / Total Assets
24. Return on Equity (ROE)
Definition: Return on equity (ROE) measures a company’s ability to generate profits from shareholders’ equity. It indicates how efficiently a business is using invested capital to generate earnings. A high ROE is a sign of effective management and financial performance, while a low ROE may suggest inefficient use of equity capital, leading to lower returns for investors.
Formula:
Net Income / Shareholders’ Equity
25. Debt-to-Equity Ratio
Definition: The debt-to-equity ratio compares a company’s total liabilities to shareholders’ equity, providing insight into its financial leverage. A high ratio suggests that a company is heavily reliant on debt financing, which could increase financial risk. A lower ratio is generally preferred as it indicates a more conservative approach to financing, with a balance between debt and equity.
Formula:
Total Liabilities / Shareholders’ Equity
26. EBITDA Margin
Definition: EBITDA margin focuses on earnings before interest, taxes, depreciation, and amortization to assess a company’s operational profitability. By excluding non-operational factors like interest and depreciation, it provides a clearer view of core earnings. A higher EBITDA margin indicates stronger profitability, while a lower margin may signal challenges with cost control or operational inefficiency.
Formula:
EBITDA / Revenue × 100
27. Free Cash Flow (FCF)
Definition: Free cash flow represents the cash generated by a business after accounting for capital expenditures. It’s a key indicator of financial health, as it shows how much cash a company has available to reinvest in the business, pay off debt, or distribute to shareholders. Positive free cash flow is a good sign of financial flexibility and growth potential.
Formula:
Operating Cash Flow – Capital Expenditures
28. Interest Coverage Ratio
Definition: The interest coverage ratio measures a company’s ability to meet interest payments on outstanding debt. It’s calculated by dividing earnings before interest and taxes (EBIT) by interest expense. A higher ratio indicates greater ability to service debt, while a lower ratio suggests higher financial risk and potential challenges in meeting debt obligations.
Formula:
EBIT / Interest Expense
29. Capital Expenditure (CapEx) Ratio
Definition: The CapEx ratio compares capital expenditures to total revenue, indicating the portion of revenue allocated to reinvestment in long-term assets. A higher ratio suggests a company is investing heavily in its future growth, while a lower ratio may signal reduced reinvestment or an emphasis on short-term profitability over long-term investment.
Formula:
CapEx / Revenue
30. Revenue per Employee
Revenue per employee calculates how much revenue is generated by each employee in an organization. This metric provides insights into workforce productivity and efficiency. A higher revenue per employee typically signifies better operational efficiency and workforce utilization, while a lower ratio may point to inefficiencies or underperformance in sales activities.
Formula:
Total Revenue / Number of Employees
How to Track Financial KPIs
Tracking financial KPIs (Key Performance Indicators) is essential for monitoring a company’s financial health, making informed decisions, and aligning strategy with performance. Here's a comprehensive guide on how to track financial KPIs effectively:
1. Identify Relevant KPIs
Start by selecting KPIs that align with your business goals, industry, and company size. For example:
- Profitability Metrics: Net profit margin, gross profit margin
- Liquidity Metrics: Current ratio, quick ratio
- Efficiency Metrics: Inventory turnover, DSO
- Growth Metrics: Sales growth rate, ROE
Tip: Avoid tracking too many KPIs—focus on the most impactful ones.
2. Set Clear Targets and Benchmarks
Determine what success looks like by defining benchmark values or targets for each KPI. These may be:
- Based on historical company performance
- Industry standards or averages
- Strategic business goals (e.g., improve DSO by 15% in 6 months)
3. Use Financial Reporting Tools or Software
Leverage accounting and ERP systems that automatically calculate and track KPIs:
- Tools to consider: Deskera ERP
- These platforms often include customizable dashboards and real-time reporting.
4. Automate Data Collection
Ensure that financial data from sources like invoices, payroll, expense reports, and bank transactions is integrated into your KPI system. Use automation to:
- Minimize manual errors
- Save time
- Enable real-time tracking
5. Visualize KPIs with Dashboards
Use data visualization tools (e.g., Power BI, Tableau, Google Data Studio) to:
- Monitor trends over time
- Spot anomalies or red flags early
- Share performance data across teams
6. Review KPIs Regularly
Schedule periodic reviews—weekly, monthly, or quarterly—depending on the KPI. For example:
- Cash flow KPIs: Weekly
- Profitability metrics: Monthly or quarterly
- Strategic KPIs like ROE: Quarterly or annually
7. Analyze and Interpret the Data
Understand what the numbers mean and take action. Ask:
- Why did this KPI improve or decline?
- What external or internal factors influenced it?
- What corrective actions or optimizations are needed?
8. Align KPIs with Decision-Making
Use KPI insights to guide:
- Budget planning
- Hiring and staffing
- Investment decisions
- Cost-cutting initiatives
- Strategic pivots
9. Involve Key Stakeholders
Share KPI reports with executives, department heads, and investors to:
- Keep everyone aligned
- Support transparency
- Encourage accountability
10. Continuously Refine KPI Tracking
As your business evolves, periodically reassess:
- Are these KPIs still relevant?
- Do they reflect current priorities?
- Should you add or retire any?
Setting Financial KPI Targets
Setting financial KPI targets is a critical step in strategic financial planning—it provides your business with measurable goals, helps drive performance, and ensures accountability.
Here's a step-by-step guide to setting financial KPI targets effectively:
1. Align with Business Goals
Start by ensuring each KPI aligns with your short-term and long-term business objectives. For example:
- If your goal is to increase profitability, set a target for Net Profit Margin or Operating Margin.
- If you aim to boost liquidity, focus on improving the Current Ratio or reducing Days Sales Outstanding (DSO).
2. Analyze Historical Data
Use your past performance as a baseline to set realistic targets. For example:
- If your average Net Profit Margin over the past year was 8%, you might set a target of 10% for the next quarter.
- Identify seasonal trends and anomalies when evaluating historical performance.
3. Benchmark Against Industry Standards
Compare your financial metrics with industry averages or key competitors. This helps you:
- Stay competitive
- Identify areas for improvement
- Set ambitious yet achievable goals
Example: If the average Gross Margin in your industry is 35%, and yours is currently 28%, aim to bridge the gap over time.
4. Make Targets SMART
Ensure your KPI targets are:
- Specific – Clearly defined
- Measurable – Quantifiable
- Achievable – Realistic based on resources and constraints
- Relevant – Linked to strategic priorities
- Time-bound – Set with a defined deadline
Example: “Increase revenue by 15% over the next 12 months.”
5. Involve Stakeholders
Collaborate with finance teams, department heads, and senior leadership when setting targets to:
- Gain different perspectives
- Ensure buy-in
- Promote shared accountability
6. Factor in External Conditions
Consider market conditions, economic forecasts, and regulatory changes that may affect performance. Adjust your targets based on:
- Inflation rates
- Consumer behavior trends
- Supply chain disruptions
7. Break Down into Sub-Targets
Decompose annual or quarterly goals into smaller monthly or departmental targets. This allows you to:
- Track progress in real time
- Identify underperformance early
- Keep teams focused on incremental success
8. Regularly Review and Adjust
Business environments change—so should your targets. Review performance against targets monthly or quarterly, and revise as needed to stay agile and competitive.
Example Target Setting Table
Common Mistakes to Avoid When Setting Financial KPI Targets
Setting financial KPI targets can drive strategic growth—but if done incorrectly, it can lead to misalignment, demotivation, and missed objectives. Here are the most common mistakes to avoid:
1. Setting Unrealistic Targets
Overly ambitious targets may seem motivating but can overwhelm teams and lead to burnout or cutting corners. Always assess your resources, market conditions, and historical performance before finalizing any figures.
2. Ignoring Historical Data
Failing to use past performance as a benchmark often results in goals that are either too lenient or too aggressive. Historical data provides valuable insights into trends, capabilities, and limitations.
3. Lack of Alignment with Strategic Goals
KPI targets that don’t support your broader business objectives lead to wasted effort. Every financial KPI should directly contribute to a larger goal—like increasing profitability, improving cash flow, or expanding market share.
4. Not Involving Key Stakeholders
Top-down targets set without input from finance teams or department heads can be disconnected from operational realities. Collaborate cross-functionally to ensure feasibility and buy-in.
5. Setting Vague or Unmeasurable KPIs
Targets like “increase efficiency” or “reduce waste” lack clarity. Always make your KPIs SMART (Specific, Measurable, Achievable, Relevant, and Time-bound).
6. Failing to Adjust for External Factors
Market conditions, competitor activity, and regulatory changes affect performance. Avoid rigid planning—build flexibility into your targets so you can adapt as needed.
7. Neglecting Regular Reviews
Setting targets and forgetting about them leads to lost opportunities. Regularly review your progress (monthly or quarterly) and update goals based on new data or business changes.
8. Overloading with Too Many KPIs
Tracking too many financial KPIs at once can dilute focus. Instead, identify 5–7 key metrics that are most relevant to your business objectives.
9. Focusing Only on Short-Term Metrics
While short-term wins are important, ignoring long-term indicators like Return on Investment (ROI) or Customer Lifetime Value (CLV) can compromise sustainable growth.
10. Not Communicating Targets Clearly
If employees don’t understand what’s expected or how their work contributes, they’re unlikely to align with financial goals. Make sure every team understands the KPIs and their role in achieving them.
Avoiding these mistakes will ensure your KPI targets are strategic, motivational, and achievable—setting your business up for measurable success.
How Deskera ERP Helps You Achieve Financial KPI Success
Deskera ERP is a cloud-based business management platform that simplifies tracking, analyzing, and optimizing financial KPIs through automation, real-time reporting, and integrated modules. Here's how it helps:
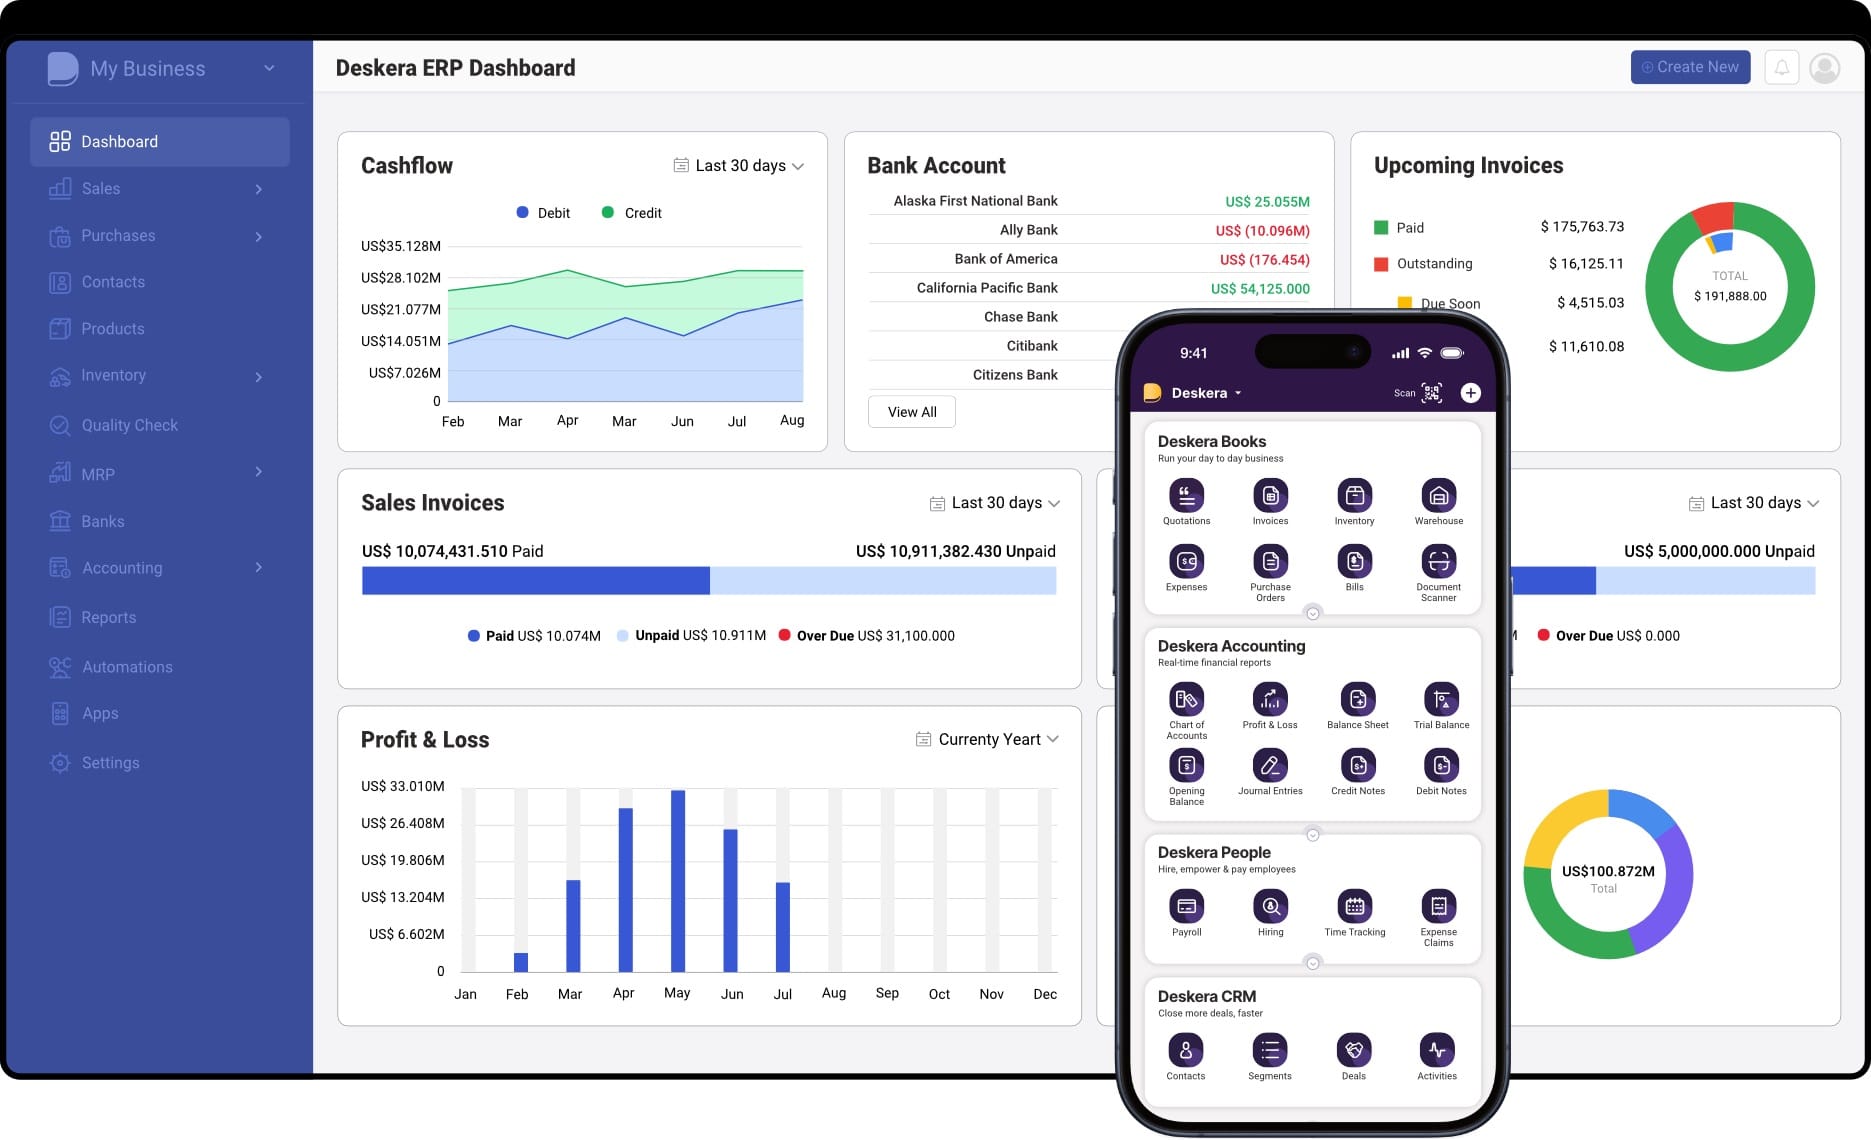
1. Real-Time Financial Reporting
Deskera provides up-to-the-minute dashboards and reports on crucial KPIs like revenue, profit margins, cash flow, and expense ratios—making it easier to make data-driven decisions and course-correct quickly.
2. Automated Accounting and Bookkeeping
The platform automates accounting processes, reducing errors and saving time. It keeps your financial statements—like balance sheets and P&L statements—up to date, which is vital for accurate KPI tracking.
3. Integrated Inventory and Sales Modules
With Deskera’s inventory and sales modules tightly linked to financial data, you can track metrics like gross profit margin, inventory turnover, and cost of goods sold (COGS) more effectively.
4. Budgeting and Forecasting Tools
Set realistic financial KPI targets using Deskera’s forecasting features. You can compare actuals vs. budgets, analyze historical trends, and adjust projections based on real-time data.
5. Customizable Dashboards for KPI Monitoring
Visualize the KPIs that matter most with customizable dashboards. Whether it's EBITDA, operating cash flow, or customer acquisition costs, you get a clear view of performance at a glance.
6. Scalability and Multi-User Access
Deskera supports growing businesses with scalable modules and multi-user access. Finance teams, department heads, and executives can collaborate in real time without losing control of sensitive financial data.
7. Compliance and Audit Readiness
With features like automatic tax calculations, audit trails, and compliance reports, Deskera helps ensure your financial records are always audit-ready—reducing regulatory risks.
8. Mobile Accessibility and Cloud Storage
Access financial KPIs and reports on the go through Deskera’s mobile app. This ensures constant visibility into business performance—ideal for decision-makers who are always on the move.
By integrating and streamlining key business functions, Deskera ERP enables businesses to monitor, manage, and meet financial KPIs with accuracy and confidence.
Key Takeaways
- Financial KPIs are essential metrics that measure your company’s financial health, performance, and progress toward strategic goals—enabling smarter business decisions.
- Key financial KPIs your business should track include Gross Profit Margin, Net Profit Margin, Operating Cash Flow, Current Ratio, Quick Ratio, Accounts Receivable Turnover, Inventory Turnover, Return on Equity (ROE), Return on Assets (ROA), Customer Acquisition Cost (CAC), Customer Lifetime Value (CLV), Burn Rate, and Revenue Growth Rate.
- From gross profit margin to cash flow and customer acquisition cost, each KPI offers unique insights that help optimize profitability, efficiency, and financial stability.
- Regularly tracking KPIs provides visibility into performance trends, supports strategic planning, and helps identify issues before they impact the bottom line.
- Use integrated tools like ERP software to automatically collect and analyze financial data for accurate, real-time KPI monitoring without manual intervention.
- Set SMART (Specific, Measurable, Achievable, Relevant, Time-bound) targets for each KPI based on industry benchmarks, historical data, and business objectives.
- Avoid tracking too many KPIs, ignoring context, and failing to act on insights. Focus on the most relevant metrics aligned with your business goals.
- Deskera ERP streamlines financial KPI tracking through automation, real-time dashboards, and integrated modules for accounting, inventory, and sales—making data-driven decisions easier.
Related Articles
 Niti Samani
 Niti Samani
 Niti Samani
 Niti Samani
 Niti Samani
 Niti Samani